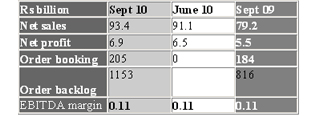
Net sales: Rs93.4 billion (expected range Rs84.9 billion-Rs95.6 billion)
Net profit: Rs6.94 billion (expected range Rs6.2 billion-Rs8.1 billion)
Highlights:
" Sales were at the higher end of the expected range and net profit at the lower end.
" Among its divisions, core engineering & construction and machinery & industrial products recorded very strong growth but electrical & electronics were weak.
Execution has picked up. This was a major worry in Q1.
" Margins, flattish, were in line with expectations. " Other income was higher as the profit from sale of investment in Satyam (about Rs700 million) and sale of property (another Rs700 million) was included in this quarter itself. " Order inflows were strong (Rs360 billion for the first half now) and were driven by the power & infrastructure segments. L&T's own in-house development projects contributed to 28% of the total inflows (vs. 5% in 1HFY10). Inflows from oil & gas are considerably reduced. " Guidance maintained at 25% order inflow growth and 20% revenue growth for FY11. " Management suggested that FY11 margin is likely to remain broadly at FY10 levels of about 13% - however, for that to happen, margins will have to go up in 2H. " L&T Infotech showed a sharp pickup in revenues. " Working capital increased to Rs49.5 billion at the end of H1FY11 (40 days of sales) from Rs26.3 billion at the end of FY10 (26 days of sales). " Debt levels went up to Rs77 billion at the end of the first half from Rs68 billion at the end of FY10 - this led to higher interest costs.
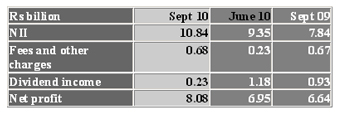
HDFC Q2
NII: Rs10.85 billion (expected range Rs9.7 billion-Rs13.2 billion) Net profit: Rs8.07 billion (expected range Rs7.6 billion-Rs8.1 billion)
Highlights:
" Net profit was at the higher end of the expected range. " Loan growth, at 20%, was in line with expectations. " Borrowing costs for NBFCs not yet started picking up, leading to stable margins. Could increase in the December quarter. " Retail disbursements were up 30% y-o-y (63% in Q1); overall disbursements were up 28% y-o-y (25% in Q1). " Did not sell down any loans this quarter. " Fee income at Rs681 million was stable y-o-y and up three times q-o-q mainly because of higher corporate business. " Spreads were stable q-o-q at 2.34% - competitive pressures have not yet touched HDFC. " Contribution from investment-linked income was lower as treasury gains and dividend income declined. " Costs of funds declined q-o-q to just a little under 7%.
(This article is based on secondary research. The report is for information only. None of the stock information, data and company information presented herein constitutes a recommendation or solicitation of any offer to buy or sell any securities. Investors must do their own research and due diligence before acting on any security. Some of the opinions expressed in this article are the author's own and may not necessarily represent those of Moneylife). — Munira Dongre

.jpg "MoneyLife")